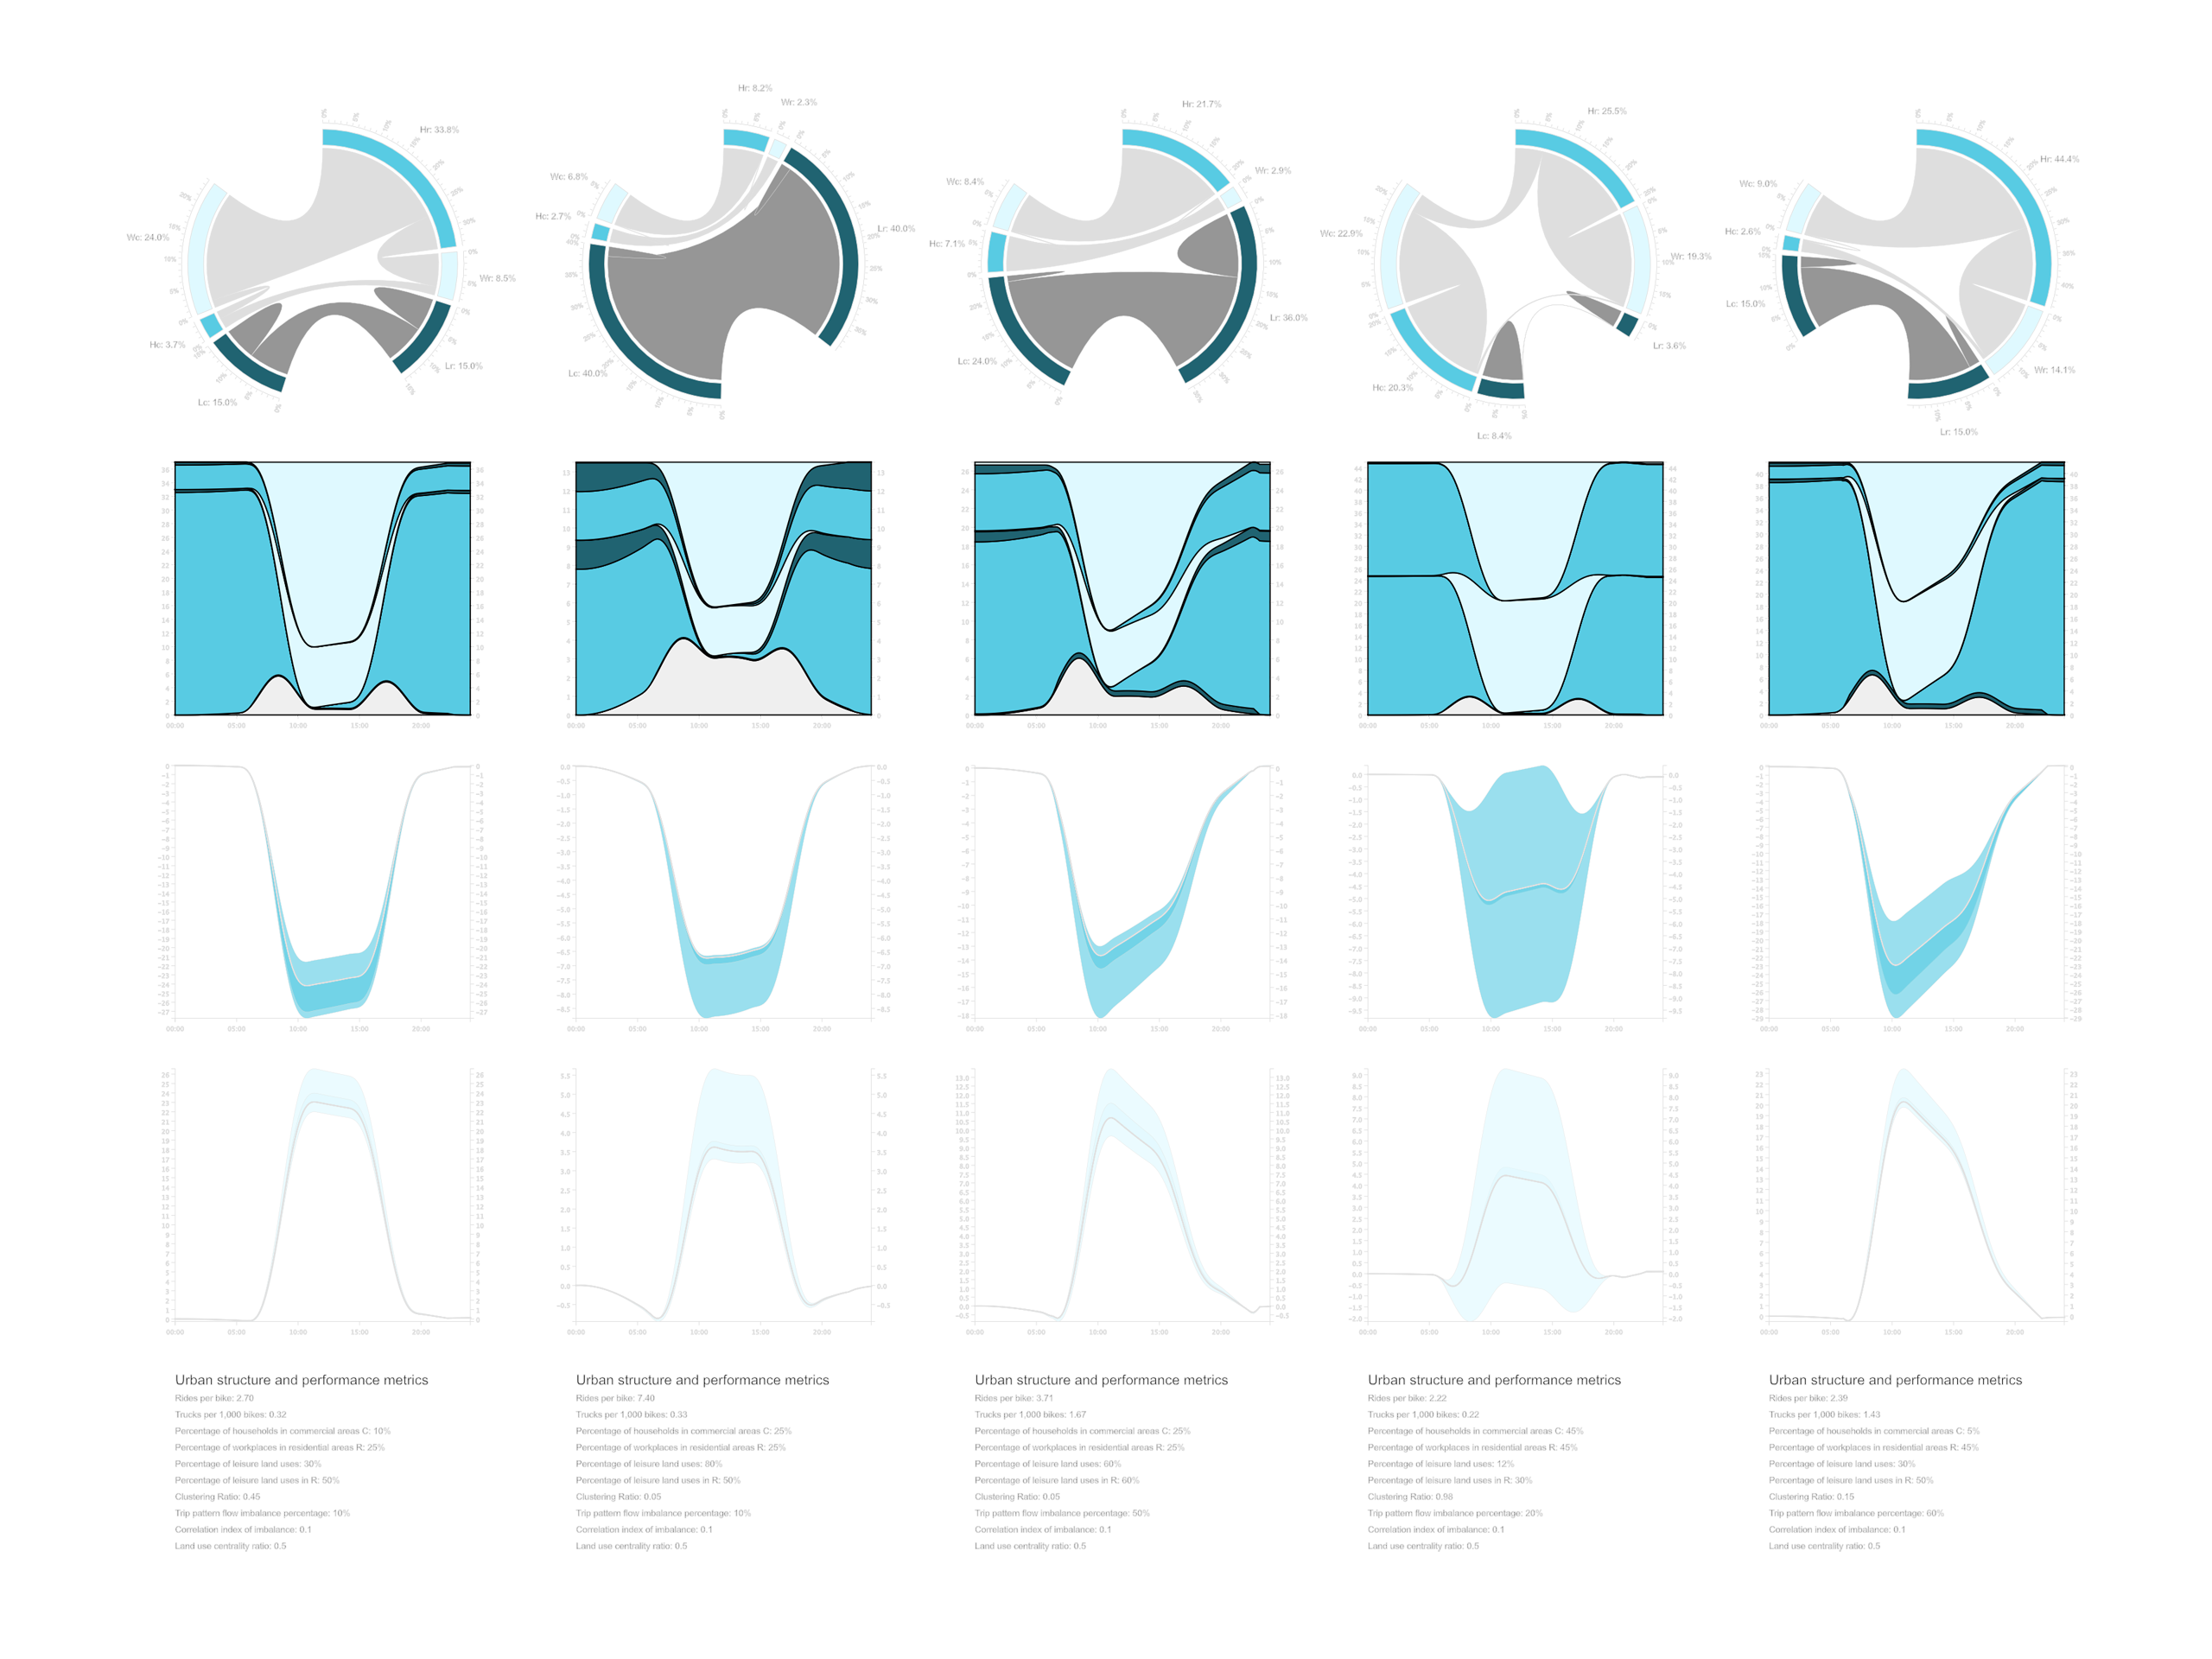
This dynamic Land Use Transport Interaction (LUTI) model demonstrates how urban form, land use patterns, and unavoidable sizing and rebalancing decisions, define ridership, cost, energy, and thereby limits of MoD systems as a result of a dynamic equilibrium. Borrowing from literature in operations research, urban economics, and system dynamics, I introduce 8 structural parameters to describe spatial allocation of land uses and trip flow imbalances, and I present two mathematical macromodels. The first links land use patterns to daily trip volumes while the second links daily trip volumes to dynamics of stock and flow fluctuations in residential and commercial areas. The amplitudes of stock fluctuations determine the size of the system while the equilibrium of flows determines the rebalancing force. The two models jointly address questions such as: how does ridership and cost depend on urban form and land use? Results show that (1) different cities have different optimal ridership, (2) density and allocation of households and workplaces have minor impact on performance compared to leisure uses, and (3) there are cities in which, given a technology, no type of MoD system can constitute a systemically sustainable solution.
Consider a city with a grid of MoD stations with constant density. The grid divides urban space into equally sized land parcels. We categorize land uses in each land parcel in three types:
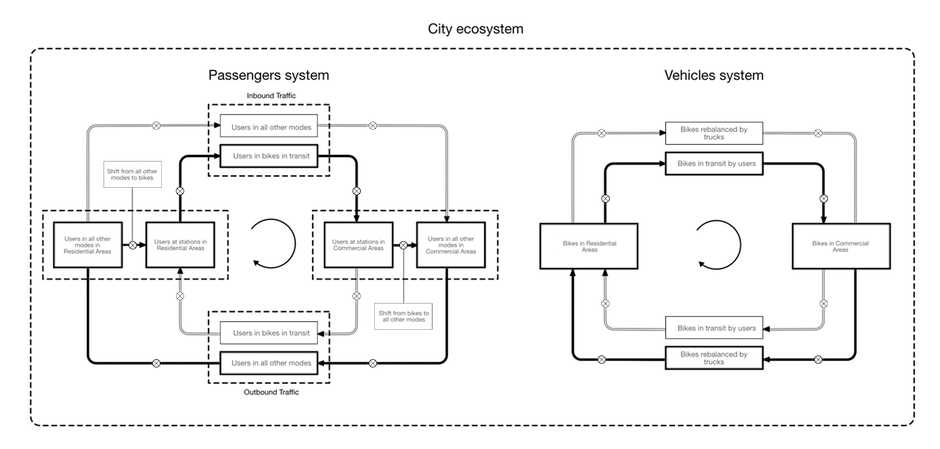
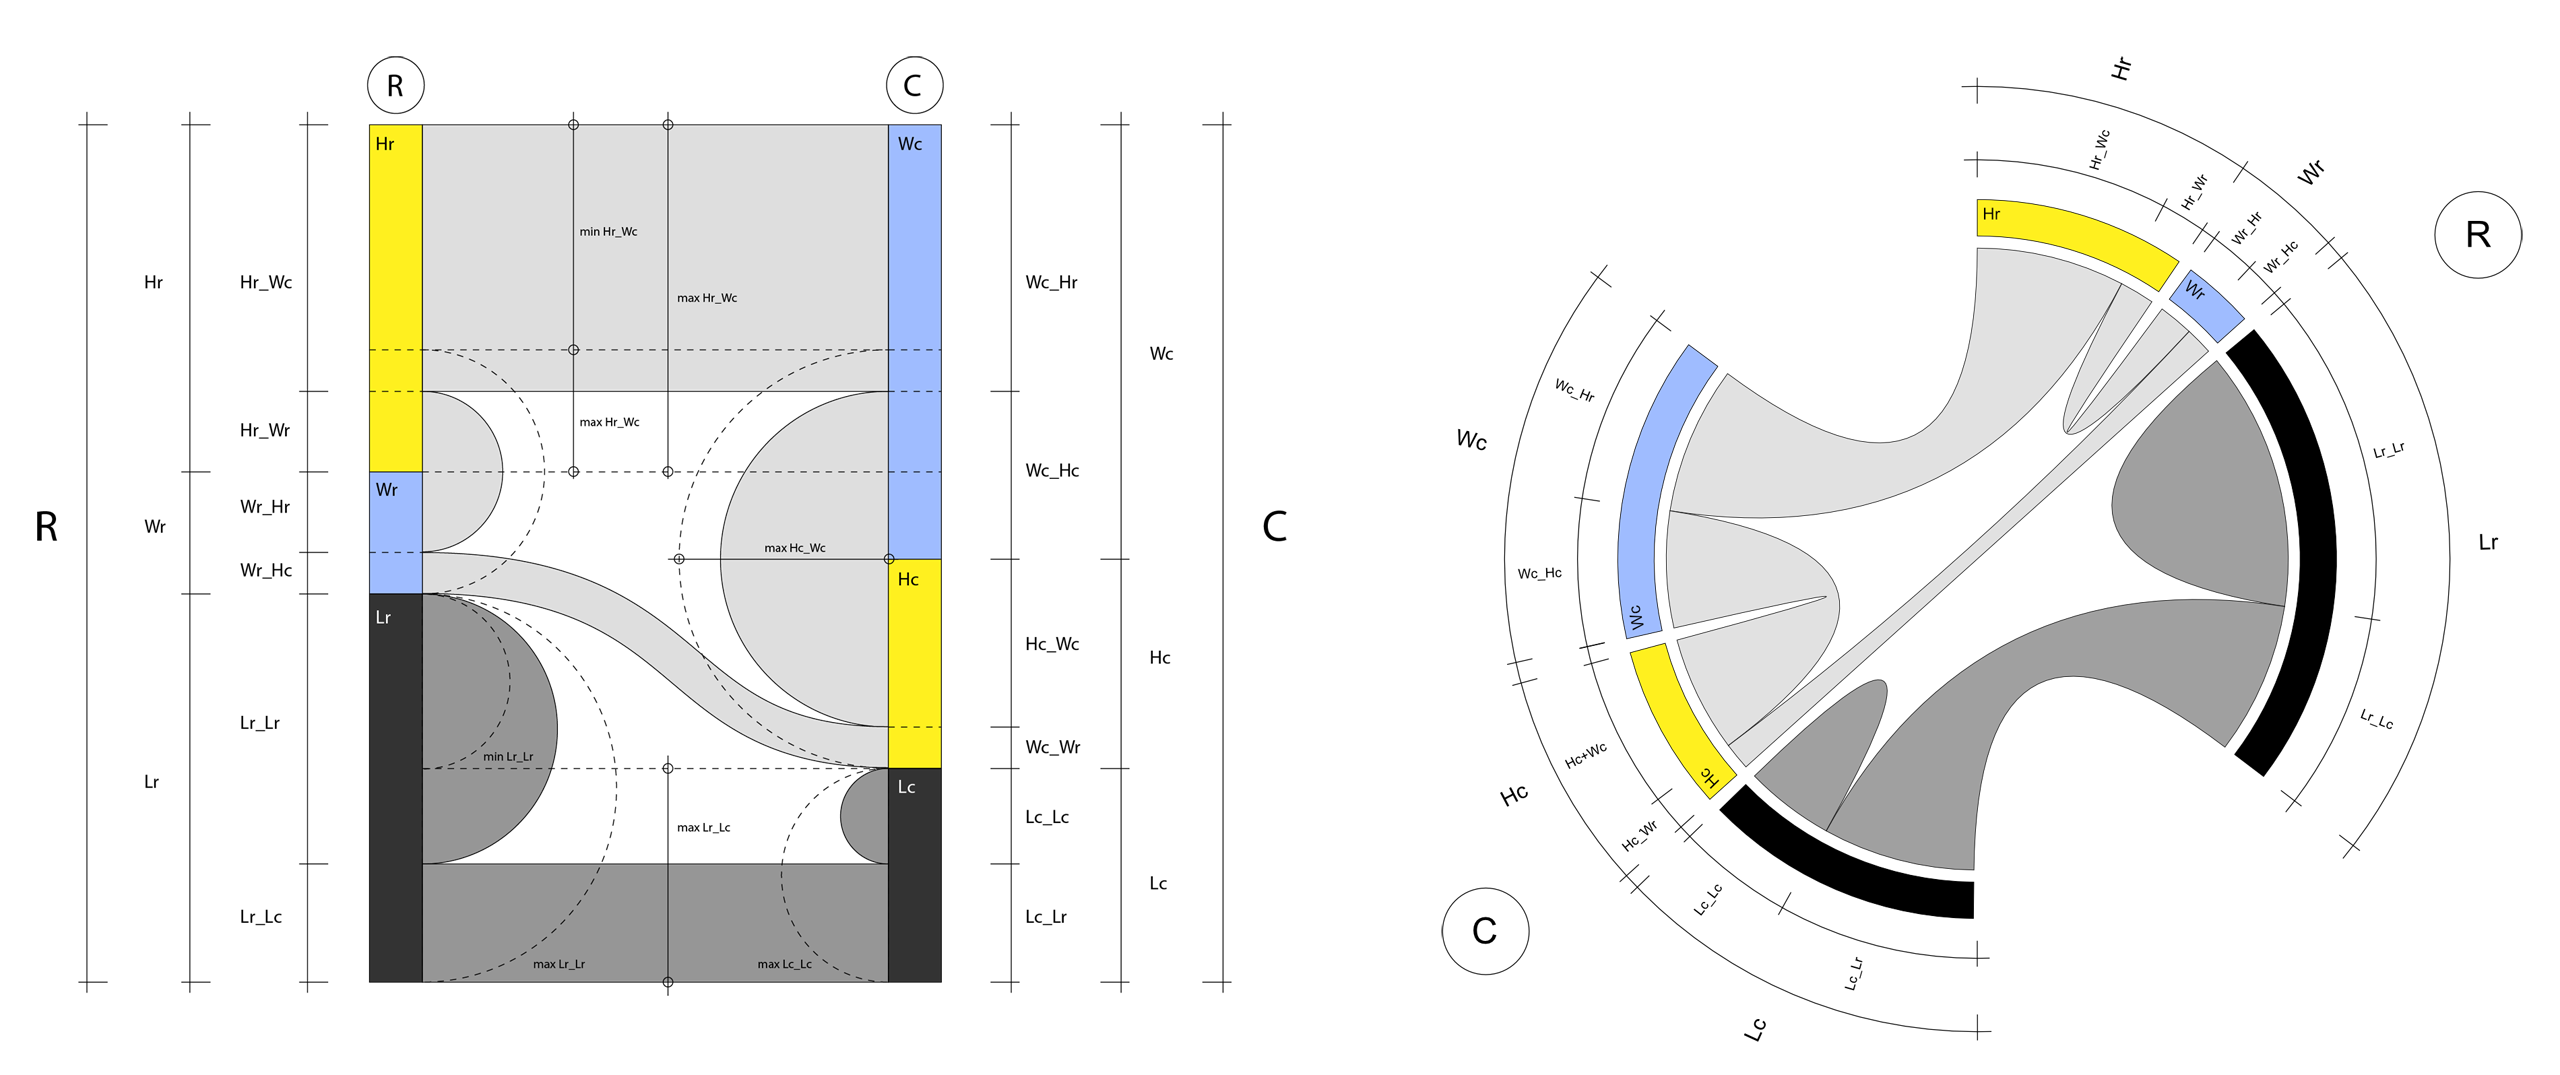
The sum of H activities equals the sum of W activities in all land parcels in the city. Daily trip volumes from households to workplaces equal daily trip volumes from workplaces to households. Likewise, for each land parcel, daily incoming trip volume equals daily outgoing trip volume.
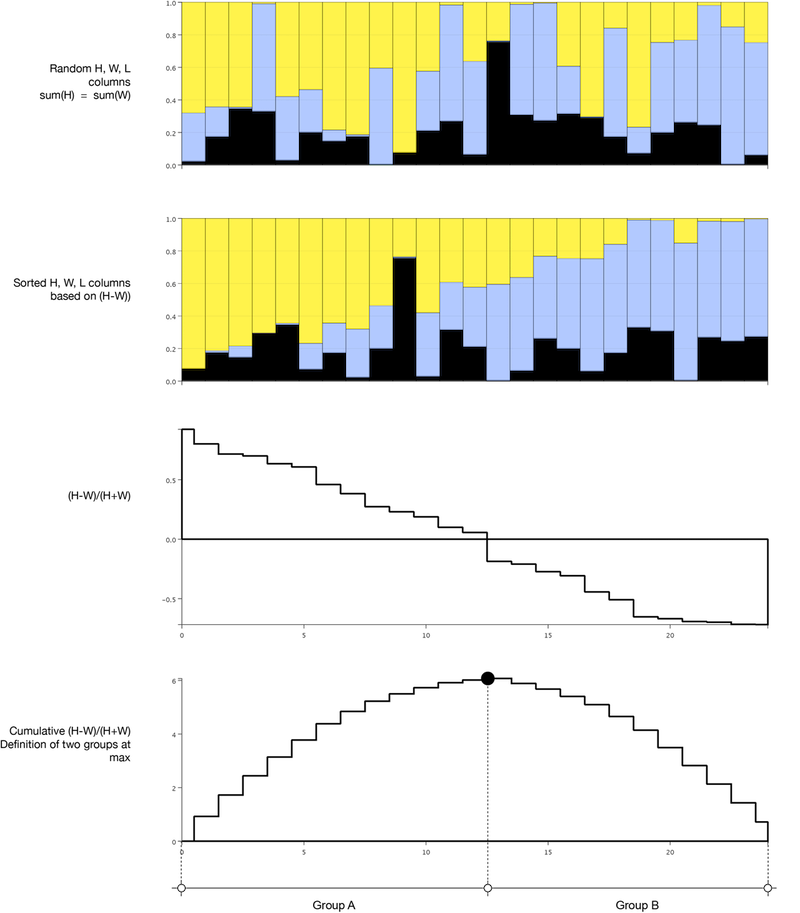
Define as residential, a parcel in which H activities dominate W activities. Define as commercial, a parcel in which W activities dominate H activities. Define as land use pattern, the pattern with which households (H), workplaces (W), and leisure land uses (L) are allocated in space. Different land use patterns create different trip patterns. Categorize trips into two types:
Every day, more than 6M user trips and 30 percent additional worker movements, shuffle continuously bikes in stations at 950 cities across the world. The vast amounts of data from this complex activity have brought scientists in front of challenging questions, not just about bike sharing, but most importantly, about the future of, more advanced, on-demand mobility systems like autonomous cars. Does sharing decrease cruising vehicles more than it increases parked vehicles? Are human mobility patterns random or predictable? To what extent does form of a city affect its mobility pattern? Are there similarities in behavior between MoD systems in different cities?
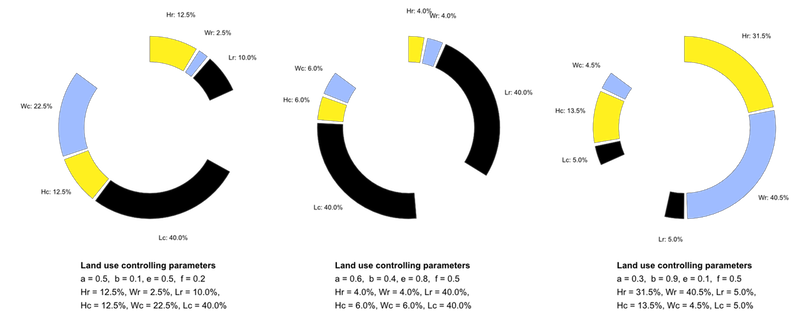
Parameter a describes the fraction of total household land uses that exist in commercial group (Hc). It ranges from 0 to 50% because by definition, households in the commercial areas are fewer than households in residential areas.
Hc = a * (Hc + Hr)
Parameter b describes the fraction of total workplace land uses that exist in residential group (Wr). It ranges from 0 to 50% because by definition workplaces in the residential areas are fewer than workplaces in commercial areas.
Wr = b * (Wr + Wc)
Parameter e describes the fraction of total land uses that are leisure uses (Lr + Lc). It ranges from 0 to 100%.
Lr + Lc = e * k
Parameter f describes the fraction of total leisure land uses that exist in residential areas (Lr). It ranges from 0 to 100%.
Lc = (1-f) * e * k
Clustering z, describes the tendency of people to live and work in the same or diametrically opposite areas. In a clustered city, people live and work in clearly defined neighborhoods creating isolated areas, or clusters, with no interconnection between them. In a dispersed city, people live and work in remotely diametrically opposite areas, traversing the city with their trips. In our two-region model, clustering ratio describes the share of the daily trip volumes between transverse trips that link land uses across the two groups, and internal trips that link land uses within each group. If clustering is high (e.g. z=0.99), there is minimum connection between R and C groups and a maximum connection within each group. If clustering is low (e.g. z=0.01) there is maximum connection between R and C groups and a minimum connection within each group.
Imbalance ratio r describes trip flow imbalances and has a range of values from 0 to 1. Trip flow imbalances occur when the daily trip volume in one direction is different than the daily trip volume in the other direction.To keep the total number of trips constant, when trips in one direction increase, trips in the other direction decrease.